OpenTelemetry Integration
Introduction
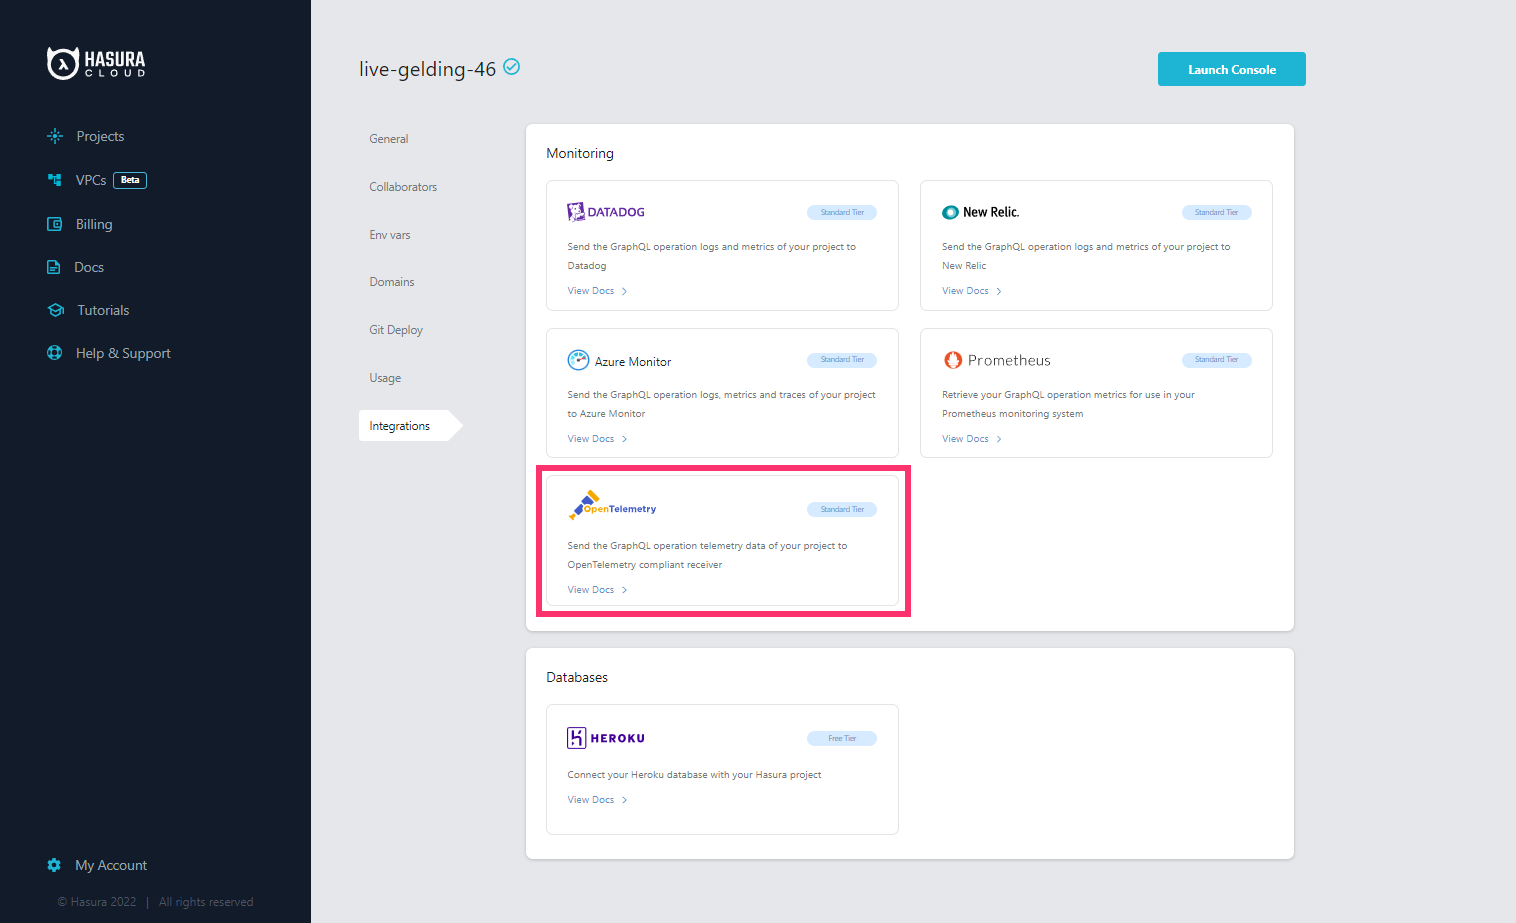
You can export traces of your Hasura Cloud project to the OpenTelemetry compliant APM receiver. This can be configured on the Integrations tab on the project's setting page.
For Hasura Cloud projects, the OpenTelemetry Integration is only available on the Standard (pay-as-you-go) tier and
above.
Currently, the OpenTelemetry Integration exports only traces. The support for metrics and logs will be added once the OpenTelemetry spec reaches stability.
Configure the OpenTelemetry integration
Navigate to the Integrations tab on the project settings page to find the OpenTelemetry integration.
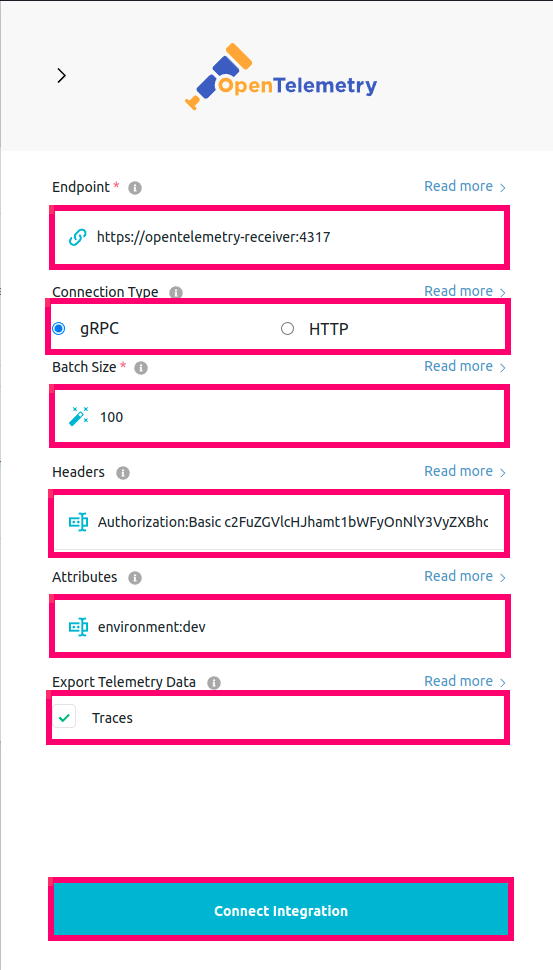
The following config parameters are needed to set up the integration with the APM receiver:
Endpoint
OpenTelemetry compliant receiver endpoint. The URL scheme (
http/https) determines if SSL(TLS) should be used for the communication. Your APM vendor will provide the OpenTelemetry Ingestion endpoint information. The appropriate endpoint for the chosen Connection Type should be used since the APM tools usually have different endpoints forHTTPandgRPCprotocols.Connection Type
Protocol to be used for the communication with the receiver. OpenTelemetry supports connections over
gRPCandHTTP. The APM vendor documentation contains the protocols it supports for OpenTelemetry ingestion, andgRPCcan be preferred if it supports bothgRPCandHTTP.Batch Size
Batch size is the maximum number of data points (spans in the context of traces) included in every export request made to the APM tool. The batch size should be an integer between 1 and 512.
Headers
Headers are (optionally) added to every request made by Hasura to the APM receiver. APM vendors will provide
Authorization/API keys with the required role/permissions to ingest OpenTelemetry data. Please refer to their
documentation for the request header formats. Headers should be added here as a key:value pair.
Attributes
Attributes are (optional) custom tags added to the telemetry data. This is usually used to identify sources in a distributed tracing environment and aids in granular filtering and analytics.
Export Telemetry Data
Selects the telemetry data points to be exported. (Note: Currently only traces are supported).
After adding appropriate values in the OpenTelemetry Integration panel, click Connect Integration.
Checking the status of the integration
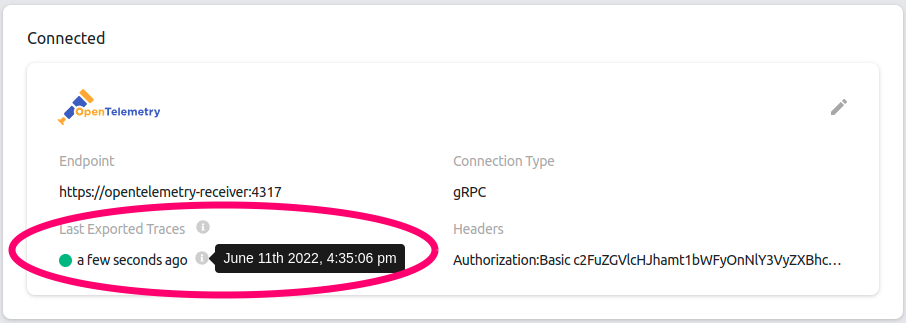
The green/red dot signifies the status of the integration. The green dot indicates a successful export of the telemetry
data to the APM receiver. Last Exported Traces is continuously updated, indicating the timestamp of the last telemetry
data that was successfully exported. The orange dot reading Not exported yet means no requests have been made to the
GraphQL API after configuring the integration.
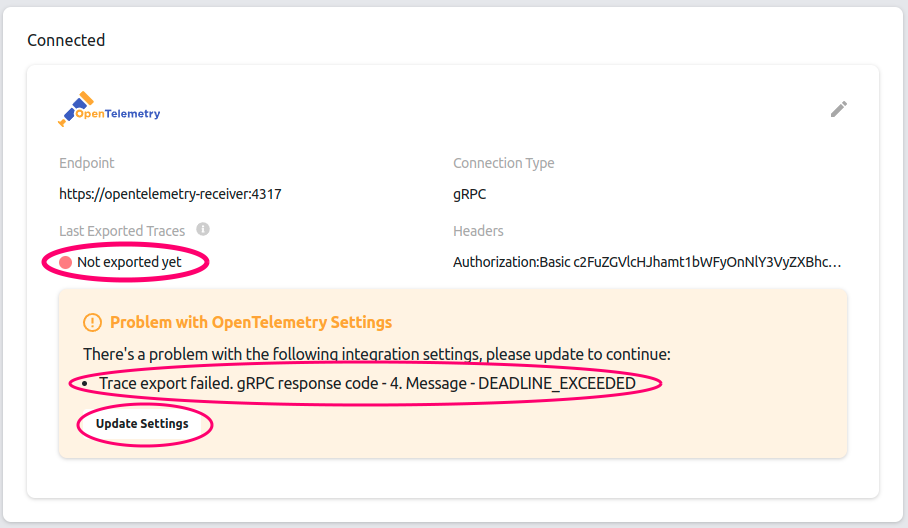
In case of errors while exporting telemetry data to the APM receiver, the dot becomes red and the error
messages/instructions are displayed. Click the Update Settings button to update the config parameters.
View traces
Use your APM vendor's UI to to visualize and perform further analytics on trace data to monitor, diagnose and
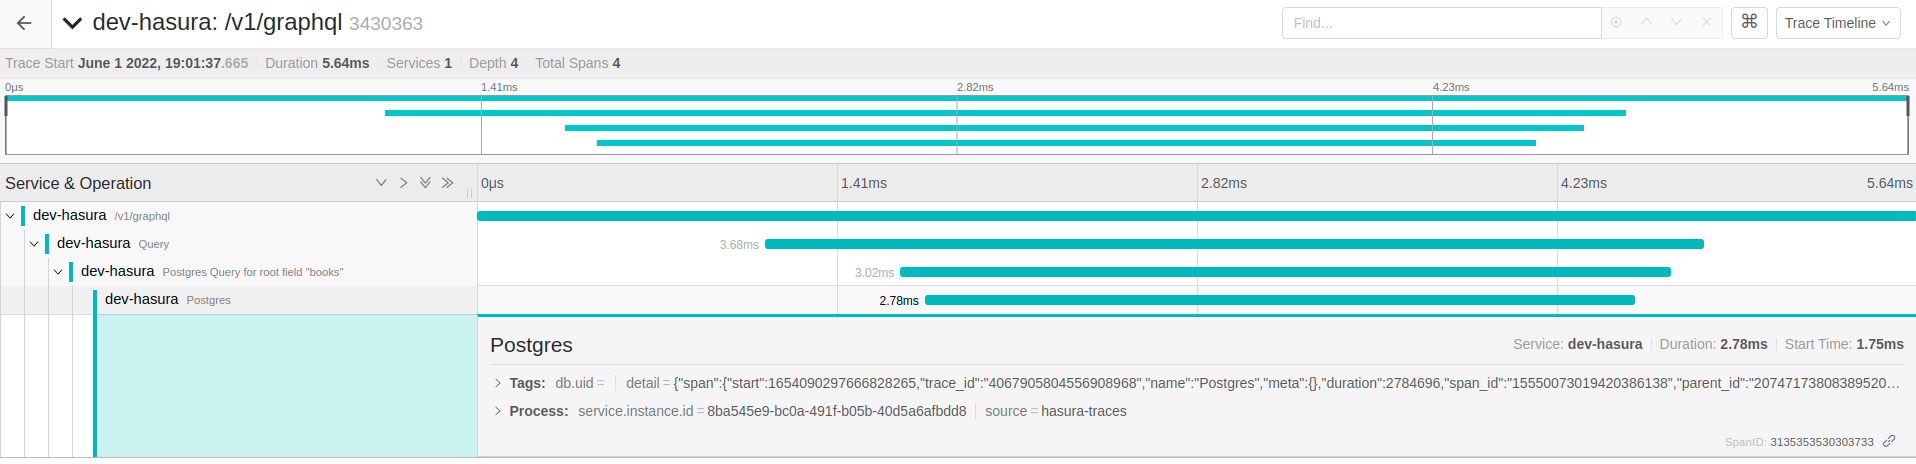
troubleshoot your application. Traces with their spans are listed out and selecting a trace shows a flame graph
containing a visual representation of where the operation spent its execution time. For example, the image below shows a
flame graph in Jaeger where a query took 5.64 milliseconds in total, of which 2.78 milliseconds was the actual
Postgres database processing the query.
OpenTelemetry collector
OpenTelemetry provides a collector to export data to APM tools that do not support native OpenTelemetry ingestion. In such cases, this OpenTelemetry integration can be configured to send the data to the collector. Note: This collector should be run in your infrastructure and should be reachable by the Hasura backend, that is configured to send the data to the APM target. The list of supported exporter targets can be found in the OpenTelemetry Collector repository.